We are pleased to share the results of our statistical analyses of visits to our portal and returns for advertisers since the 2nd half of 2022. These results should of course be read in the light of the recent history of our site and the general property market.
The rural property advertising portal ma-propriete.fr was launched on 27 May 2021. Initiated by Bernard Charlotin, a former estate agent specialising in agricultural and winegrowing transactions, it was designed to bring together all types of rural property and to facilitate transactions in the countryside.
The statistics for the first year are difficult to use, as the site's visibility and reputation were naturally too low.
The site is still growing and has not yet reached its full potential in terms of visibility, but the current statistics already allow us to draw some interesting conclusions.
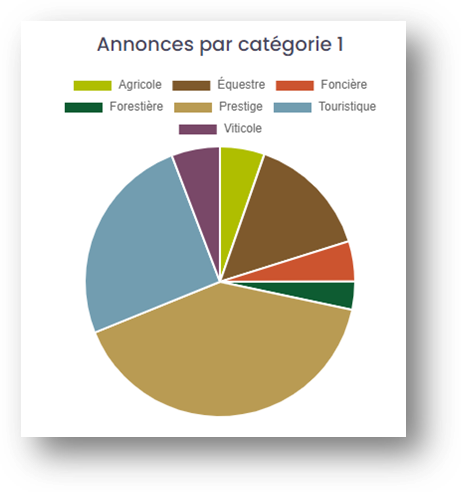
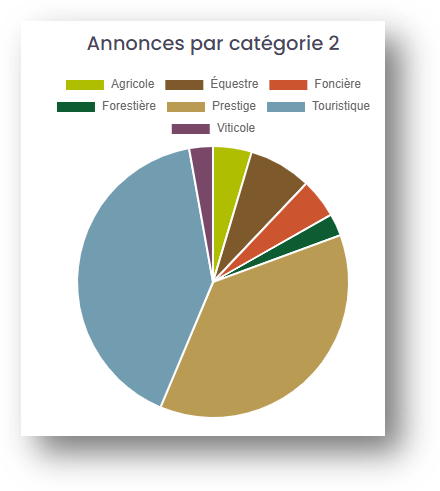
The breakdown of ads by category is constantly changing, but is roughly as follows:
|
|
1rst category |
2nd category |
|
Agricole |
5% |
5% |
|
Equestre |
15% |
7% |
|
Foncière |
5% |
5% |
|
Forestière |
3% |
3% |
|
Prestige |
41% |
37% |
|
Touristique |
25% |
41% |
|
Viticole |
6% |
3% |
The site was launched a year after the COVID19 health crisis. This period was marked by a boom in property transactions. The shift in consumer expectations towards more space (inside and out) was accompanied by historically low interest rates.
With the exception of Paris, prices have risen sharply until the end of 2022 (+30% between 2015 and 2022).
However, the war in Ukraine has changed the economic situation, with inflation starting to rise sharply. This inflation led to a loss of purchasing power for households and a gradual rise in interest rates, from 1% in January 2022 to almost 4.5% in December 2023.
This sudden change led to a downturn in the property market, with a fall in transactions (down 21% in 2023 compared with 2022) and the start of a fall in prices. This situation will continue in 2024, despite the start of a fall in property rates.
We have studied the traffic figures for our property portal from the 2nd half of 2022 to the 1st half of 2024. As previously indicated, we did not include the figures for the 1st year, as their interpretation was too uncertain.
By tracking the visibility of our ads, we can measure the awareness of our site and of each property category.
|
|
2nd half 2022 |
1st half 2023 |
2nd half 2023 |
1st half 2024 |
|
Agricole |
44 863 |
83 798 |
151 423 |
213 299 |
|
Equestre |
113 303 |
266 388 |
432 897 |
468 254 |
|
Foncière |
67 111 |
129 016 |
157 734 |
151 306 |
|
Forestière |
51 118 |
107 069 |
153 247 |
179 225 |
|
Prestige |
270 032 |
589 151 |
804 292 |
737 798 |
|
Touristique |
95 203 |
287 848 |
496 328 |
604 692 |
|
Viticole |
22 883 |
59 189 |
114 304 |
110 312 |
|
TOTAL |
664 513 |
1 522 459 |
2 310 225 |
2 464 886 |
|
Progress |
|
+129% |
+52% |
+7% |
| Number of ad views by category | ||||
|
|
2nd half 2022 |
1st half 2023 |
2nd half 2023 |
1st half 2024 |
|
Agricole |
7% |
6% |
7% |
9% |
|
Equestre |
17% |
17% |
19% |
19% |
|
Foncière |
10% |
8% |
7% |
6% |
|
Forestière |
8% |
7% |
6% |
7% |
|
Prestige |
41% |
39% |
35% |
30% |
|
Touristique |
14% |
19% |
21% |
25% |
|
Viticole |
3% |
4% |
5% |
4% |
|
TOTAL |
100% |
100% |
100% |
100% |
| Share of ad views by category | ||||
As awareness of the site grew, the number of ad views rose sharply until the end of 2023. At the beginning of 2024, the number of ad views was still rising, but by less (+7%), reflecting the current difficulties in the property market.
The breakdown of visibility for professional ads (agricultural, equestrian, land, forestry and wine) remains stable overall at 45% of total views. These ads represent approximately 35% of all ads. The rural specialisation of our site, and its organisation into 7 categories, therefore seems to meet the needs of Internet users.
This is particularly true for forestry ads, which although few in number (only 3% of ads) generate 7% of visits. And for equestrian ads (15% of ads and 19% of visits).
For more residential listings (prestige and tourist properties), tourist properties are increasingly consulted, rising from 14% of visits to 25%. Our portal has become a benchmark site for gîte and guest house transactions. This sharp increase (x 6.3 in the number of views) in visibility is taking place at the expense of prestige properties, even though the increase in views has remained significant since the 2nd half of 2022 (x 2.7 in the number of views).
Tourist estates comprise several sub-categories, including gîtes and guest houses. This category also includes "farms, barns and farmhouses", which are usually former farm buildings in the countryside with a land area of more than 1 hectare.
These properties can be used to develop tourism projects, as they often have a large built-up area. They are also suitable for residential properties, equestrian properties or small agricultural projects.
Other tourism estates include inns, campsites, hotels, unusual accommodation and function rooms.
|
|
2nd half 2022 |
1st half 2023 |
2nd half 2023 |
1st half 2024 |
|
Gîtes |
27 945 |
111 285 |
208 498 |
273 308 |
|
Maison d’hôtes |
10 040 |
32 465 |
57 277 |
53 343 |
|
Fermes, granges, mas |
54 028 |
131 752 |
204 281 |
234 060 |
|
Autres domaines touristiques |
3 190 |
12 346 |
26 272 |
43 981 |
|
TOTAL |
95 203 |
287 848 |
496 328 |
604 692 |
|
Progress |
|
+202% |
+72% |
+21% |
| Number of ad views in the Tourism sub-categories | ||||
|
|
2nd half 2022 |
1st half 2023 |
2nd half 2023 |
1st half 2024 |
|
Gîtes |
29% |
39% |
42% |
45% |
|
Guest house |
11% |
11% |
12% |
9% |
|
Farms, barns, farmhouses |
57% |
46% |
41% |
39% |
|
Other tourist areas |
3% |
4% |
5% |
7% |
|
TOTAL |
100% |
100% |
100% |
100% |
| Share of ad views in Tourism sub-categories | ||||
The number of gîte adverts viewed has increased 10-fold in the space of 2 years. This is of course primarily due to the growing reputation of our site in this sector of the tourist industry.
Secondly, it's a sign of the continuing appeal of this type of project, despite the current property crisis. This is borne out by recent statistics on second homes from property broker Petto.
The purpose of an advertising portal is to generate buyer contacts for advertisers. The figures for these returns are confidential, but we can show you the changes in both contact forms and call intentions.
|
|
2nd half 2022 |
1st half 2023 |
2nd half 2023 |
1st half 2024 |
|
Progress |
+65% |
+23% |
-25% |
-8% |
| Growth in the number of contact forms | ||||
|
|
2nd half 2022 |
1st half 2023 |
2nd half 2023 |
1st half 2024 |
|
Agricole |
11% |
10% |
12% |
13% |
|
Equestre |
19% |
19% |
22% |
18% |
|
Foncière |
13% |
12% |
8% |
8% |
|
Forestière |
13% |
15% |
13% |
14% |
|
Prestige |
31% |
26% |
23% |
21% |
|
Touristique |
10% |
15% |
20% |
22% |
|
Viticole |
3% |
3% |
3% |
4% |
|
TOTAL |
100% |
100% |
100% |
100% |
| Share of contact forms by category | ||||
After peaking in the first half of 2023, contact forms sent to sellers fell in the second half of 2023 and the first half of 2024. This fall since mid-2023 is a direct consequence of the slowdown in the property market.
Professional ads
Professional properties account for between 57% and 59% of contact forms, whereas they represent around 35% of ads. Our site therefore reaches a qualified audience who contact sellers for this type of property.
Residential ads
In contrast, prestige listings (30% of listings) generate proportionally fewer contacts. And conversions fell sharply over the period, from 31% to 21% of forms.
Tourist properties (25% of ads), on the other hand, are attracting more and more web users. The proportion of contact forms has risen from 10% to 22%.
Focus on tourist properties
|
|
2nd half 2022 |
1st half 2023 |
2nd half 2023 |
1st half 2024 |
| Overall growth in the tourism sector |
+48% |
+75% |
+1% |
+2% |
| Trend in the number of contact forms in the tourism category | ||||
|
|
2nd half 2022 |
1st half 2023 |
2nd half 2023 |
1st half 2024 |
|
Gîtes |
34% |
39% |
55% |
57% |
|
Guest house |
16% |
12% |
13% |
4% |
|
Farms, barns, farmhouses |
41% |
41% |
24% |
22% |
|
Other tourist areas |
9% |
8% |
9% |
16% |
|
TOTAL |
100% |
100% |
100% |
100% |
| Share of contact forms for tourism sub-categories | ||||
The number of contact forms continued to rise in the first half of 2024, whereas it stagnated or fell for all other property categories.
Within this category, the proportion of messages for gîtes and guest houses has risen from 50% to over 60%.
|
|
2nd half 2022 |
1st half 2023 |
2nd half 2023 |
1st half 2024 |
|
Progression |
+156% |
+26% |
-26% |
-17% |
| Number of call intentions | ||||
|
|
2nd half 2022 |
1st half 2023 |
2nd half 2023 |
1st half 2024 |
|
Agricole |
18% |
15% |
15% |
14% |
|
Equestre |
22% |
19% |
22% |
22% |
|
Foncière |
12% |
13% |
8% |
7% |
|
Forestière |
15% |
16% |
17% |
20% |
|
Prestige |
20% |
21% |
18% |
14% |
|
Touristique |
9% |
12% |
16% |
19% |
|
Viticole |
3% |
4% |
4% |
5% |
|
TOTAL |
100% |
100% |
100% |
100% |
| Share of call intentions by category | ||||
An Internet user who calls a salesperson is generally more motivated than one who simply fills in a contact form. This is therefore a very strong signal to follow, which tells us something about the quality of the audience reached by our portal.
After a sharp increase in the first half of 2023, the number of intended calls then fell sharply, reflecting the difficulty of financing projects in the face of the sharp rise in property interest rates.
Professional listings
Professional properties account for around 70% of intended calls (compared with just under 60% for contact forms). This confirms the quality of our professional audience.
This is particularly true of forestry ads, which account for only 3% of ads but account for 14% of contact forms and 20% of call intentions.
Residential ads
In contrast, prestige ads (30% of ads) generate proportionally fewer contacts. And conversions fell sharply over the period, from 20% to 14% of forms.
As with contact forms, the proportion of call intentions for tourist properties has continued to rise, from 9% to 19%.
Focus on tourism properties
|
|
2nd half 2022 |
1st half 2023 |
2nd half 2023 |
1st half 2024 |
| Overall growth in the tourism sector |
+125% |
+64% |
-4% |
-2% |
| Trend in the number of call intentions in the tourism category | ||||
|
|
2nd half 2022 |
1st half 2023 |
2nd half 2023 |
1st half 2024 |
|
Gîtes |
37% |
43% |
52% |
54% |
|
Guest house |
17% |
14% |
15% |
11% |
|
Farms, barns, farmhouses |
38% |
38% |
26% |
25% |
|
Other tourist areas |
8% |
5% |
7% |
10% |
|
TOTAL |
100% |
100% |
100% |
100% |
| Share of call intentions for tourism sub-categories | ||||
Intended calls for gîtes and guest houses rose sharply until mid-2023, before stagnating in a very unfavourable market overall.
In a difficult property market, ma-propriete.fr is providing ever-increasing visibility in the niche market of rural property sales.
The benefits for sellers are increasing, despite a fall in the number of intended calls.
While the site still generates few conversions for prestige properties, a highly competitive market, it has already succeeded in reaching its target for professional properties (agricultural, equestrian, forestry, etc.) as well as for tourist properties such as gites and guest houses.
A word from Bernard Charlotin, Chairman:"In just 3 years, we have succeeded in achieving our primary objective of making ma-propriete.fr the benchmark portal for rural property transactions. We have succeeded in reaching qualified customers for professional projects as well as for tourist properties, particularly rural gîtes. It is this segment of tourist properties that has enabled us to steadily increase our number of professional advertisers. We are going to continue our efforts to increase our visibility in these different rural markets. Our short-term objective is to increase the number of our advertisers and thus the number of ads we run. To this end, we have expanded our range of services. For example, we're offering free downloads of high-quality white books on successful rural projects. These white papers enable us to reach a large audience of buyers, who can then contact our sellers. We have also set up a free service for collecting projects from buyers and sellers. This service enables us to generate leads from buyers (80%) and sellers (20%), which we then pass on to our advertisers according to their specialities and areas of intervention. |